Ideal for stroke prevention
Saving and analysing all ECG results and blood pressure values is fast and easy with the Veroval® medi.connect software.
Mobile ECG function:
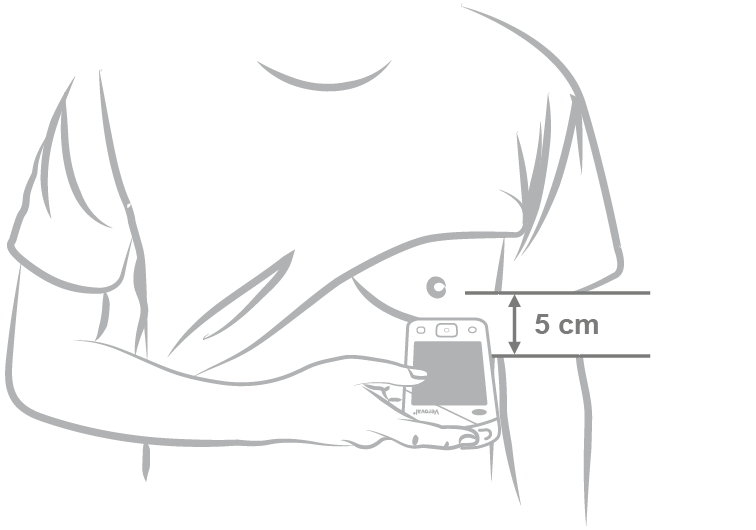
• Heart rhythm can be recorded in just 30 seconds ‒ anywhere and anytime
• Simple analysis of measured values using a traffic-light system
• Detects cardiac arrhythmias such as extrasystoles, an early sign of circulatory disorders, and inflammation of the heart muscle
• Results are displayed immediately in an easily understandable format; plus a detailed view (electrocardiogram) for your doctor
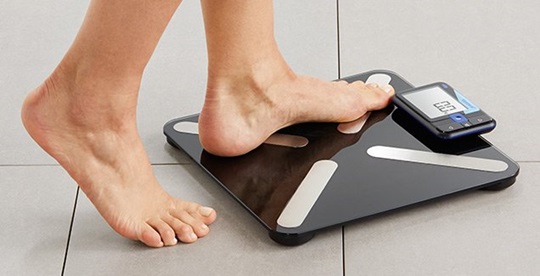
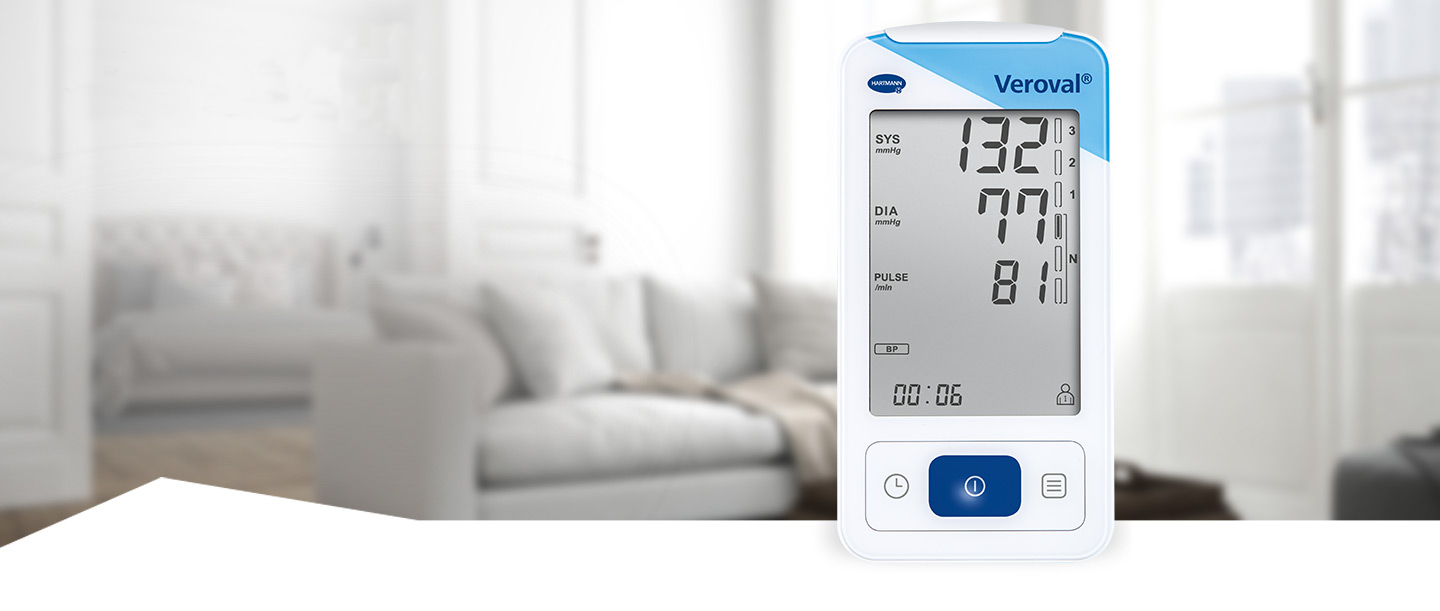
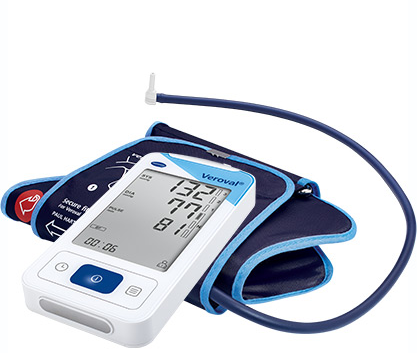
Fully automatic blood pressure measurement function:
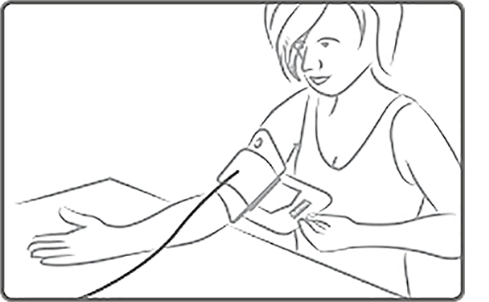
• For gentle and precise upper arm measurements
• High measuring accuracy
• Comfortable universal size cuff with ergonomic fit
• Simple analysis of measured values using a traffic-light system
• Data can be easily saved using the Veroval® medi.connect software
• Data can be shared between all Veroval® devices such as the scale and activity tracker
• USB Bluetooth adapter included
Information about ECG
Excitation states of the heart can be assessed using an electrocardiogram. A contraction of the heart muscle is always caused by an electrical stimulus. The resulting changes in voltage can be measured on the surface of the body and their course can be recorded and graphed. The Veroval® ECG and blood pressure combined device is a single-channel ECG that can detect different arrhythmias. Basic recording and assessment is carried out automatically by the combined device. It automatically evaluates whether the heart rhythm is too fast (Fig. 3), too slow (Fig. 2), irregular (Fig. 5 and 6), associated with pauses (Fig. 4) or normal (Fig. 1). This will be shown by a clear symbol on the display immediately after the measurement.
High level of precision verified:
The Veroval® 2in1 combined device has had its superior measurement quality validated and been awarded the European Society of Hypertension quality seal of approval.
Veroval® medi.connect
Login to manage your health: Easily store and analyse the data of your devices. You can compare different analytical periods (day, week, month) to automatically generate perfectly prepared images of your values. All the results can be printed out for your doctor or sent by email.